dygraphOptions dateWindows
-
Re: dygraphOptions in REXYGEN HMI Designer
Hello,
I'm looking into the possibility to zoom in by default, so when you open the page with the trend, on a part of a trend plot in REXYGEN HMI software.
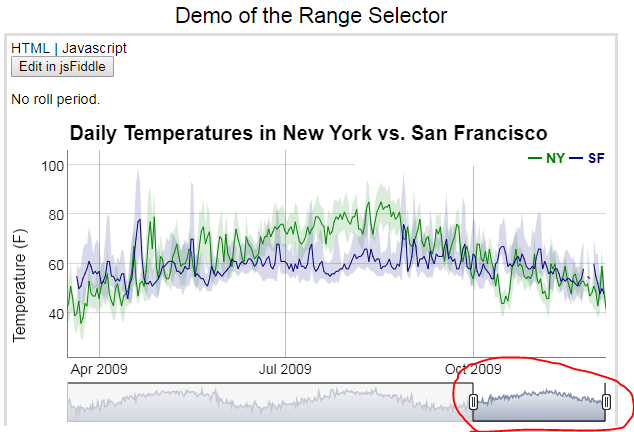
In the above mentioned topic on the old forum, that is referring to the options in dygraph, I found some interesting link that referred to a "date Windows".
dateWindow #
Initially zoom in on a section of the graph. Is of the form [earliest, latest], where earliest/latest are milliseconds since epoch. If the data for the x-axis is numeric, the values in dateWindow must also be numbers.Type: Array of two numbers
Default: Full range of the input is shownUnfortunately I do not succeed to figure out the required code in the "options" to select for instance only the last 8 hours of a trendchart that is using for instance 3 full days.
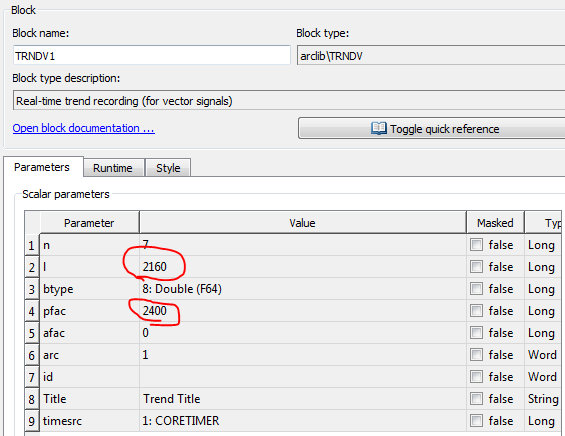
I'm sampling every 2 minutes (pfac = 2400) and have a trendplot of 3 days (l = 2160).
Unfortunately I don't find what exact code should be used to achieve the behavior as referred to in the example online.
Any help would be greatly appreciated.Thanks,
Peter -
Hi Peter,
thanks for interesting feature request.
It is possible to set dygraph options in REXYGEN HMI Designer - which means that it is static. According to the dygraph docs the dateWindow should be dynamically changed according to the desired time window (which is constantly moving): "earliest/latest are milliseconds since epoch".
The only workaround in my mind for now is to use two trend plots - one 8h and one 3 days long.Cheers,
Tomas -
Thanks Tomas,
Not exactly what I want.
But what about this "Link-Interaction" Dygraph type?
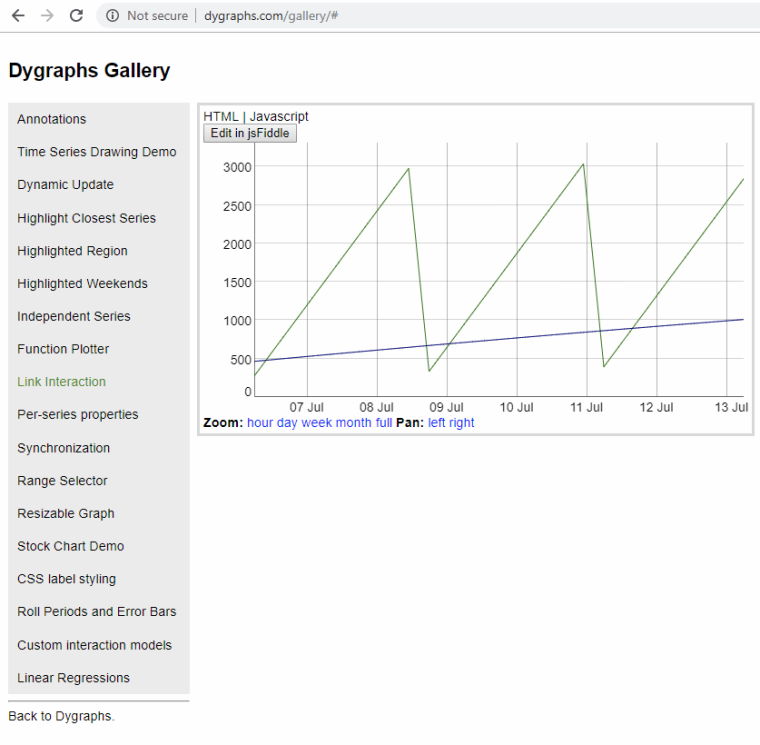
Here a possibility to zoom to an hour, day or week etc. and move this time span to the left or to the right with the Pan parameters listed....Can such a graph be implemented in Rexygen?
Peter
-
Hello Peter,
we are using dateWindow function during trend refresh. Thus every time we get a new data the time widow is adjusted. So you are not able to use this attribute for custom default zoom. I suggest to follow the @cechurat recommendation and create a 3 hour trend.Best regards,
Ondrej -
Thank a lot for explanation Ondrej.
I will proceed accordingly.Best regards,
Peter